
A Customer Effort Score (CES) survey is a powerful tool for understanding how easily your customers interact with your products or services. Essentially, a CES survey measures the ease of customer experiences, giving you valuable insights into how smoothly your customers can achieve their desired outcomes.
Now, if the idea of creating a CES survey makes you feel a bit out of your depth, don’t worry! It might seem tricky or confusing at first glance, especially if it’s your first time. But here’s the good news: it’s really not as difficult as it seems, and I’m here to walk you through every step of the process.
In this article, I’m going to cover everything you need to know about CES surveys. We’ll explore how to set one up, the right CES questions to ask, provide a CES survey example, and even explain how to calculate your Customer Effort Score (CES).
So, let’s dive in!
Table of Contents:
- Why Run a CES Survey?
- How to Create a CES Survey in WordPress (Step-by-Step)
- CES Survey Questions and Examples
- How to Calculate CES (Customer Effort Score)
- FAQs About CES Surveys
Why Run a CES Survey?
Running a Customer Effort Score (CES) survey is a fantastic way to get to the heart of your customers’ experiences with your business. Simply, a CES survey helps you understand how much effort your customers need to exert to achieve their goals, whether buying a product, getting support, or navigating your website.
So, why should you care about the effort your customers are putting in?
Well, if interacting with your business is more of a hurdle than a hop, customers are less likely to stick around, make future purchases, or recommend you to their friends. That’s why a CES survey is such a powerful tool. It reveals which parts of your customer journey might be causing unnecessary friction.
You might be familiar with tools like the Net Promoter Score (NPS) or the Customer Satisfaction Score (CSAT). These are great for measuring overall loyalty and customer happiness in the short term. However, a CES survey pinpoints specific areas where making things easier for your customers could massively boost their satisfaction and loyalty.
Research from the Harvard Business Review shows that when customers expend less effort, they tend to stick around longer, refer more friends, and are more likely to buy from you again. Essentially, making things easy for your customers doesn’t just make them happier; it also makes good business sense.
How to Create a CES Survey in WordPress (Step-by-Step)
Now that we understand why measuring customer effort is important let’s dive into how you can create a CES survey on your WordPress site using the UserFeedback plugin.
It’s a straightforward process, even if you’re new to WordPress or surveys in general!
Step 1: Install UserFeedback
First off, you’ll need to get the UserFeedback plugin installed on your site. UserFeedback is a fantastic tool for capturing customer feedback right through WordPress. It offers a range of features that make creating, customizing, and analyzing surveys a breeze.
To get started, head over to the UserFeedback pricing page and choose the license that suits your needs. The Plus plan gives you access to premium templates and features like page-level targeting.
If you’re ready to explore customization and advanced features more deeply, the Pro plan is for you.
Want to take it for a spin before committing? There’s a free version you can use for this tutorial as well.
Once you’ve selected a plan, follow the instructions to purchase, install, and activate UserFeedback on your WordPress site. If you encounter any installation hiccups, check out this guide: How to Create a Survey in WordPress.
Step 2: Create a New CES Survey
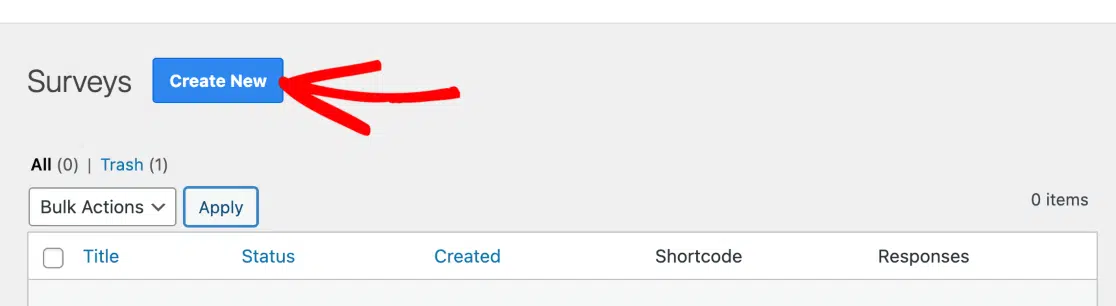
With the plugin activated, navigate to your WordPress dashboard and go to UserFeedback » Surveys. Click on the blue Create New button to begin crafting your CES survey:
Here, you’ll see a variety of templates based on your license level. Look for the Website Experience template at the top and select it.
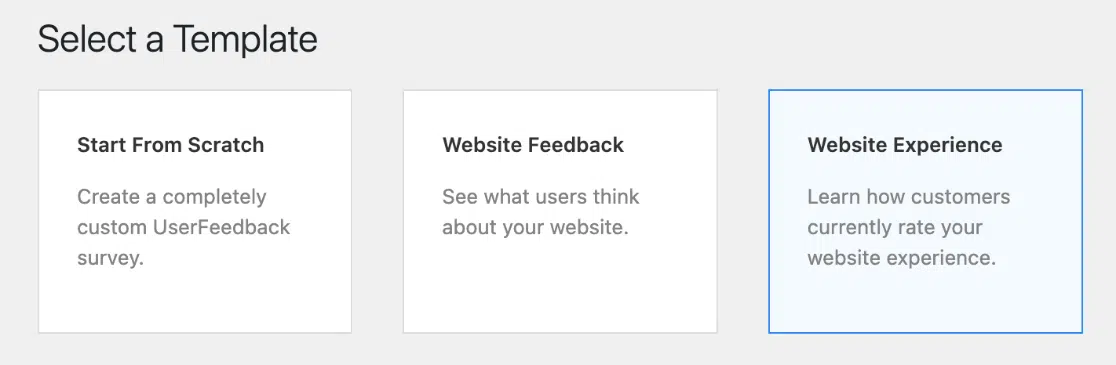
This editable 5-point customer effort score template is perfect for what we’re doing today.
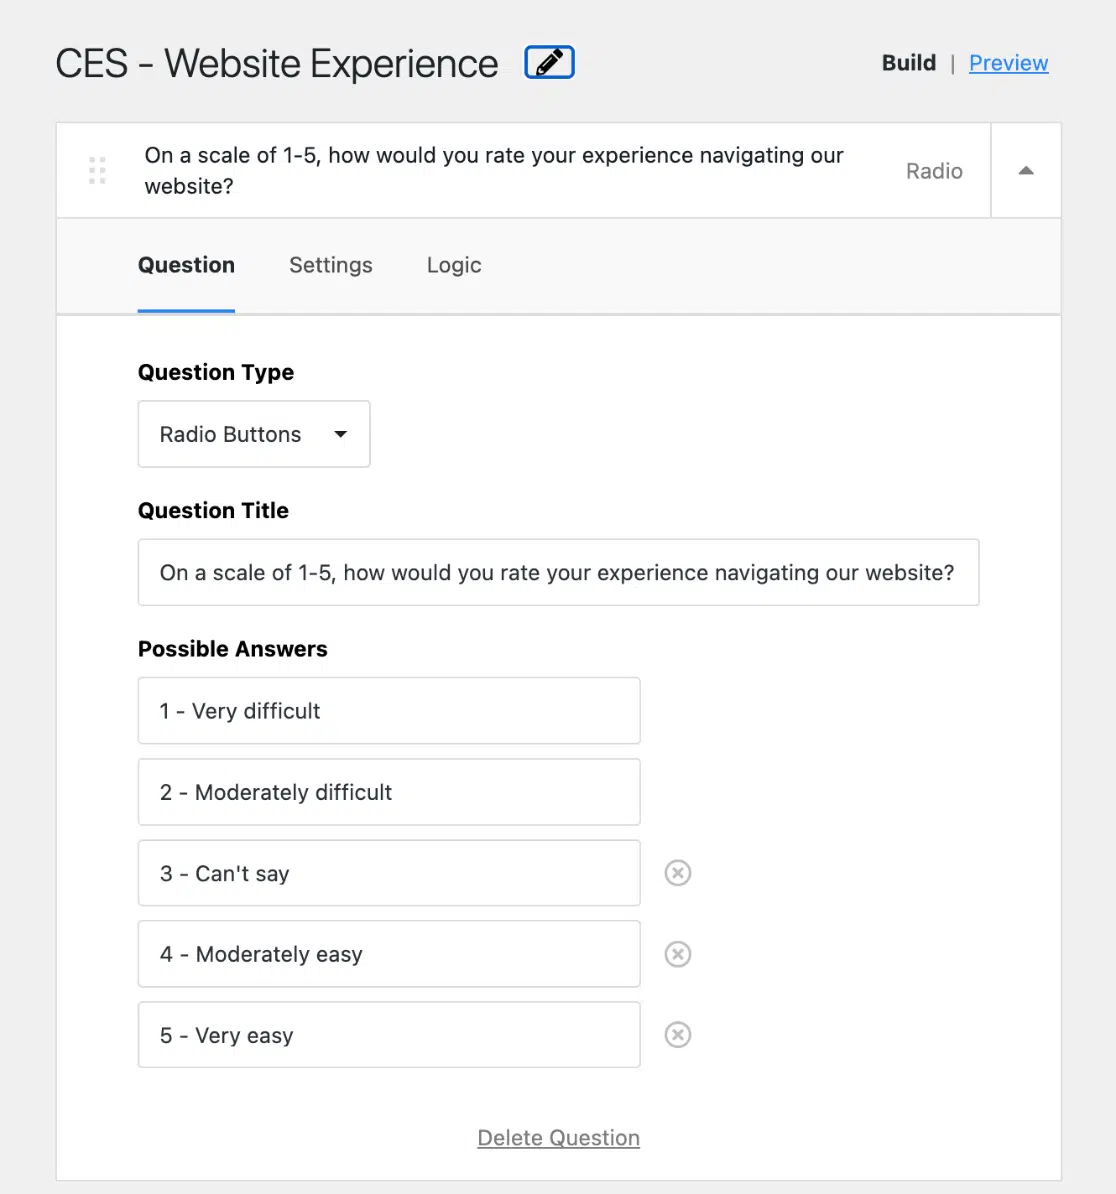
To personalize it, click the Pencil icon at the top to rename your survey. Though this name is just for your own reference and won’t be visible to users, it helps keep your surveys organized.
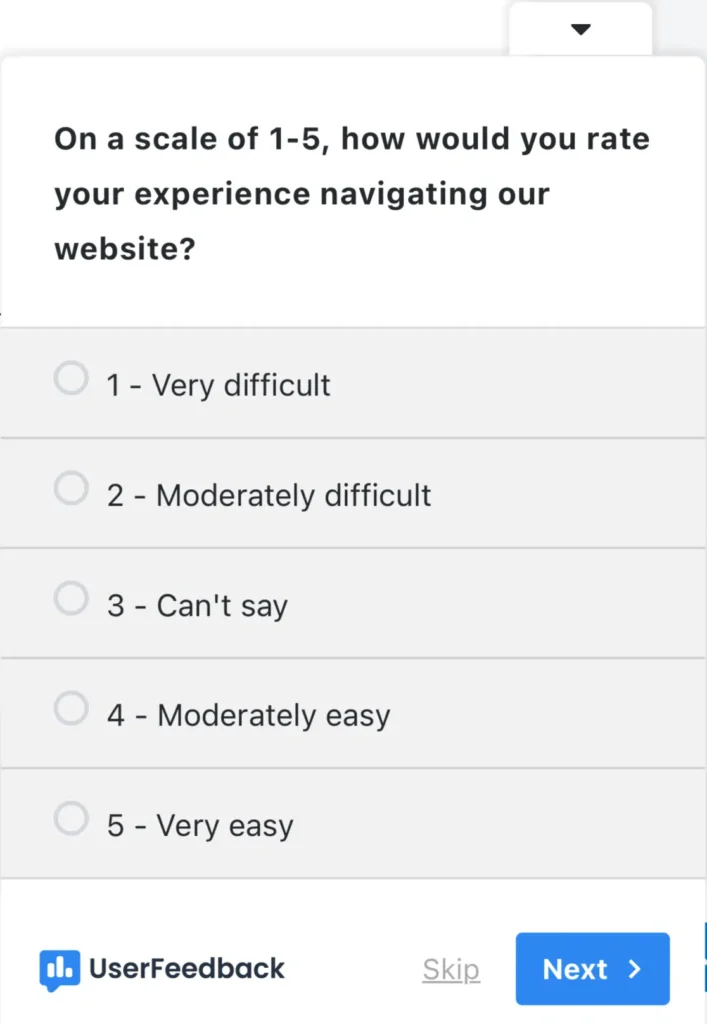
Under the Question Title, you can modify the question to suit your needs.
For example, you might want to ask, “How would you rate your experience navigating our website?” Tailor the Possible Answers section, too, to ensure clarity on what each number represents in terms of ease of use:
If you have the premium version of UserFeedback, there’s a Preview option in the top right corner where you can tweak the design of your survey widget to match your brand’s style:

Explore the Settings and Logic tab for additional options. Here, you can add a comment box for users to provide more detailed feedback, use conditional logic for a series of questions, and more.
Finally, customize your Thank You Message to show after users complete the survey, or use the Pro feature to redirect users after they submit their responses:
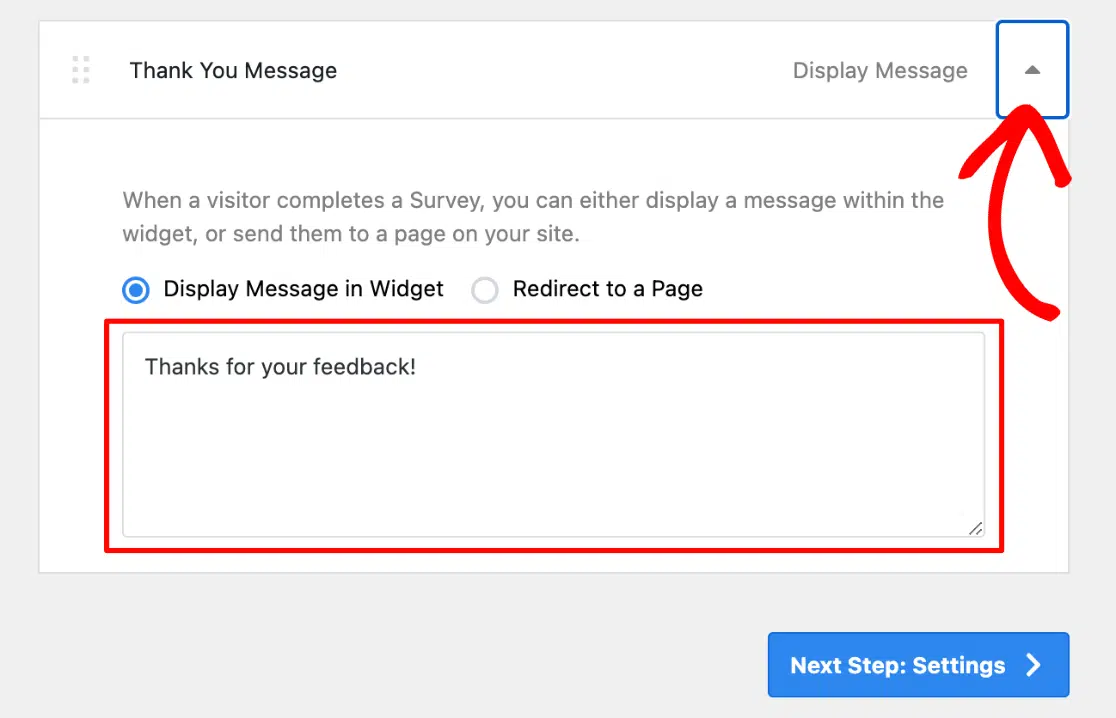
Once you’re happy with your survey, hit Next Step: Settings at the bottom to continue setting it up.
Step 3: Edit CES Survey Settings
Once you’ve set up your survey, it’s time to fine-tune the settings to get the most out of your CES survey.
First, you’ll find the Tracking option.
I recommend you keep this feature toggled on. This allows UserFeedback to work seamlessly with MonsterInsights, enabling you to track your users’ interactions and responses.
![]()
For those using the Pro version, you have additional settings under Targeting and Behavior. These settings let you choose exactly where, when, and how your survey will appear on your site.
For instance, if you want to ask, “How easy was it to use our online checkout process?” you can set the survey to pop up on the purchase confirmation page only. You can also decide how long your CES survey should run for.
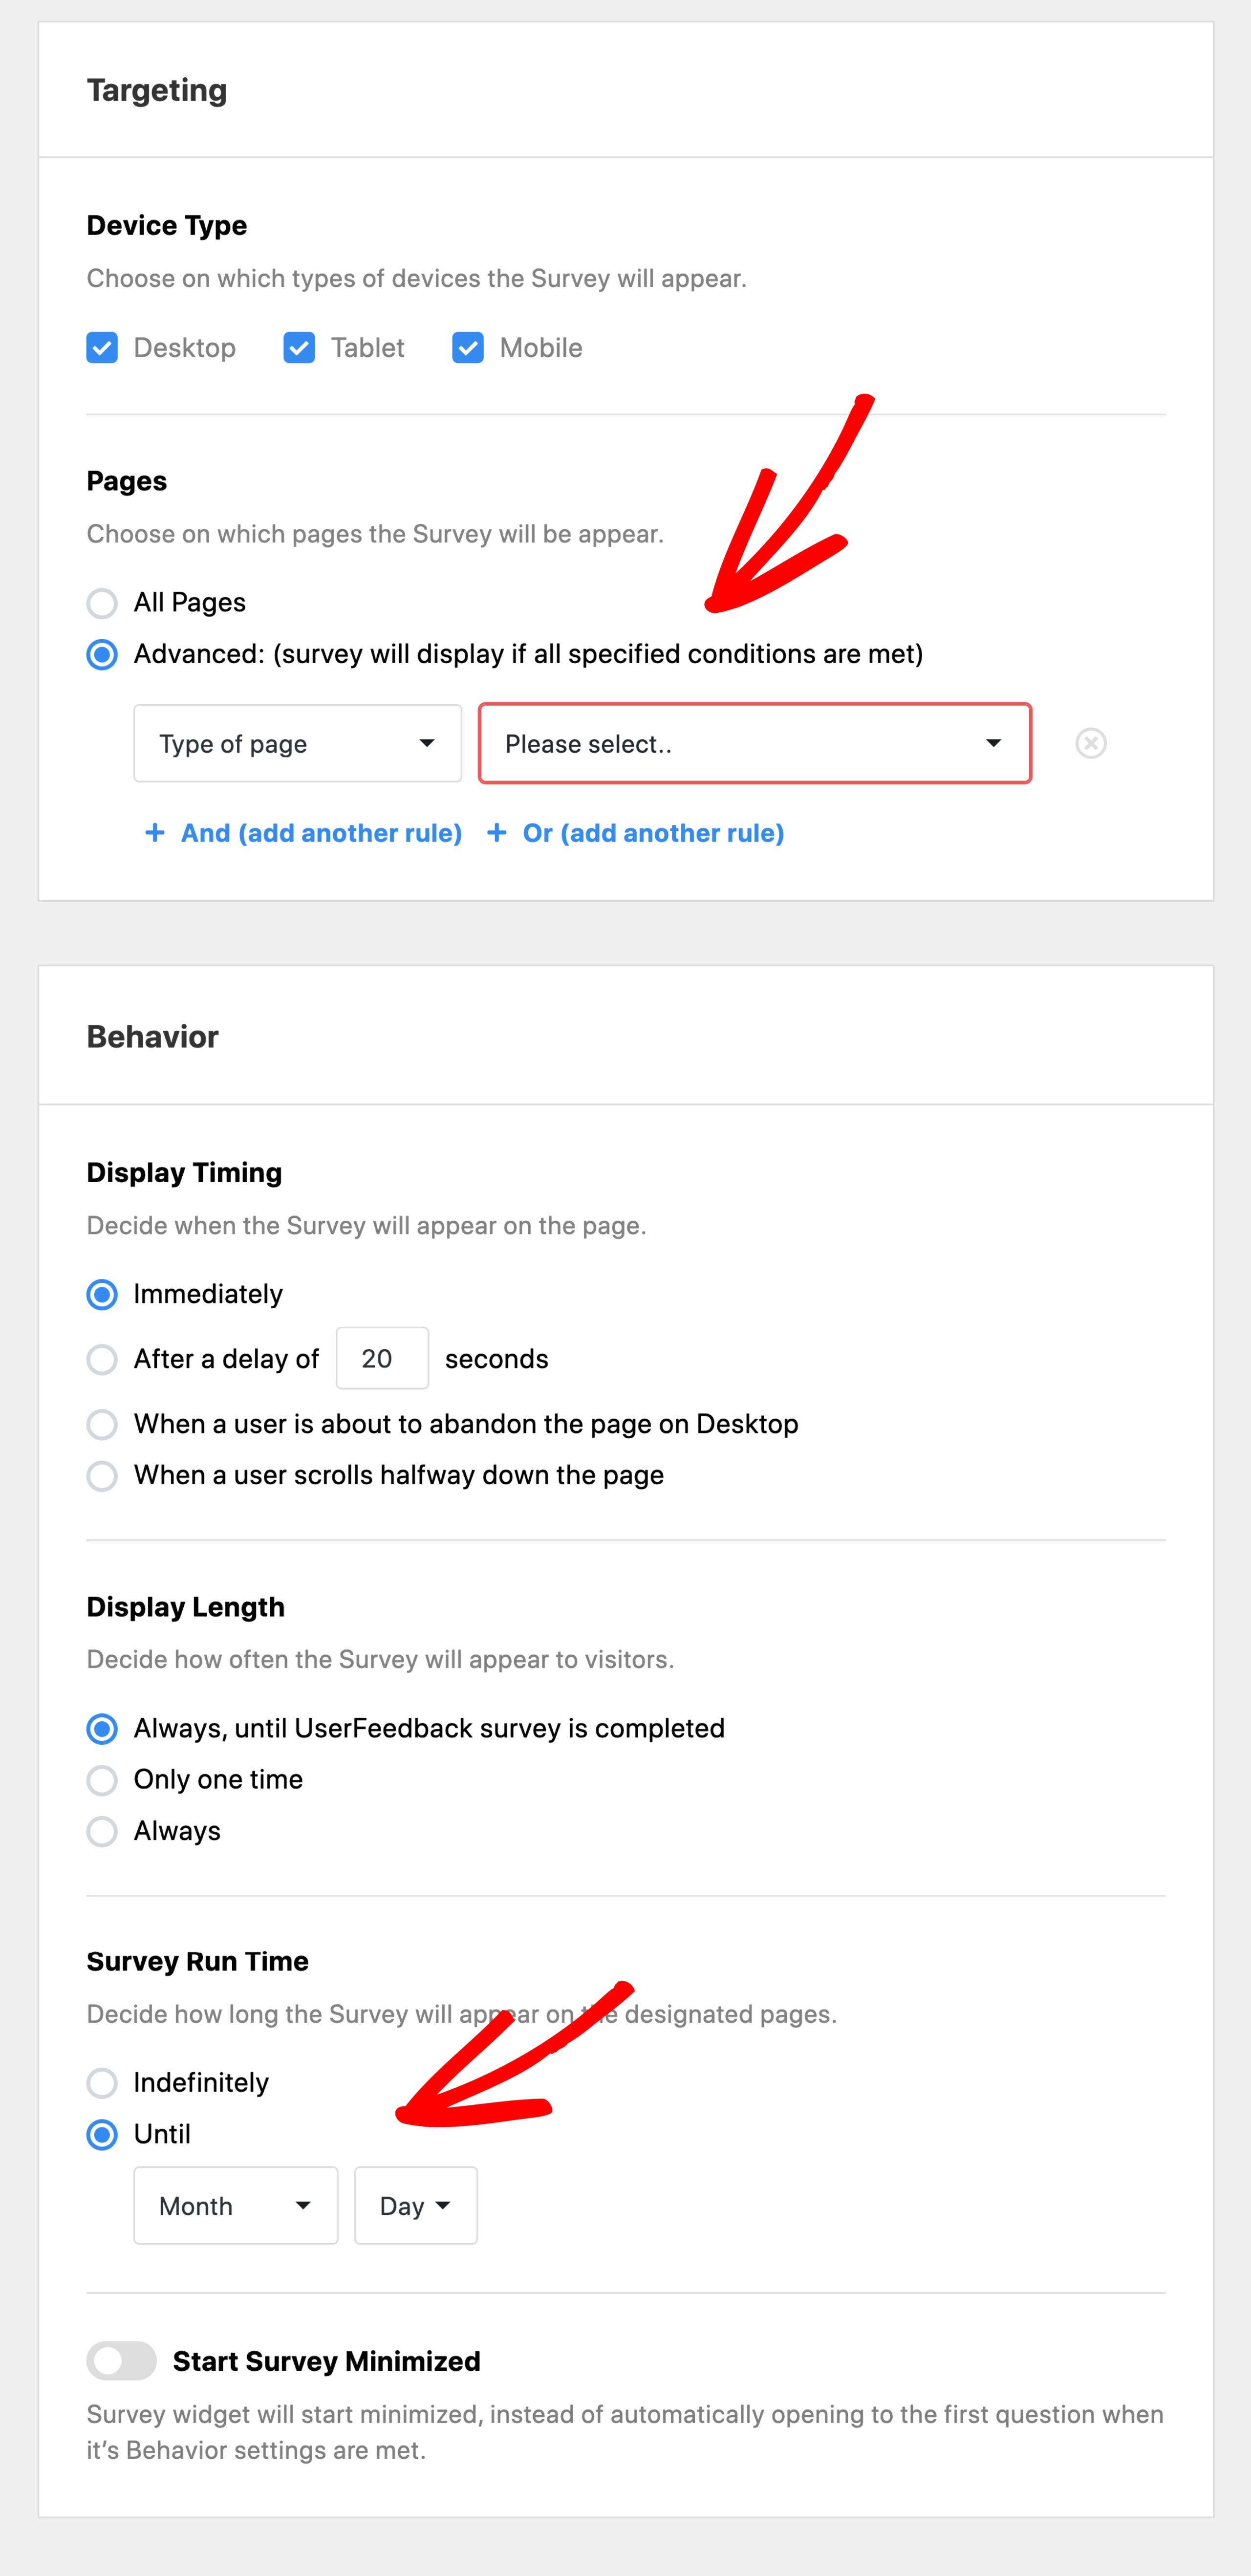
Once you’ve configured these settings, click Next Step: Notifications at the bottom.
In the Notifications step, decide if you’d like to receive email notifications when someone submits a response to your survey.
Pro users have a nifty feature where you can enable Conditional Logic to customize which responses trigger an email notification. This is super handy for staying updated on specific feedback without getting bombarded by emails.
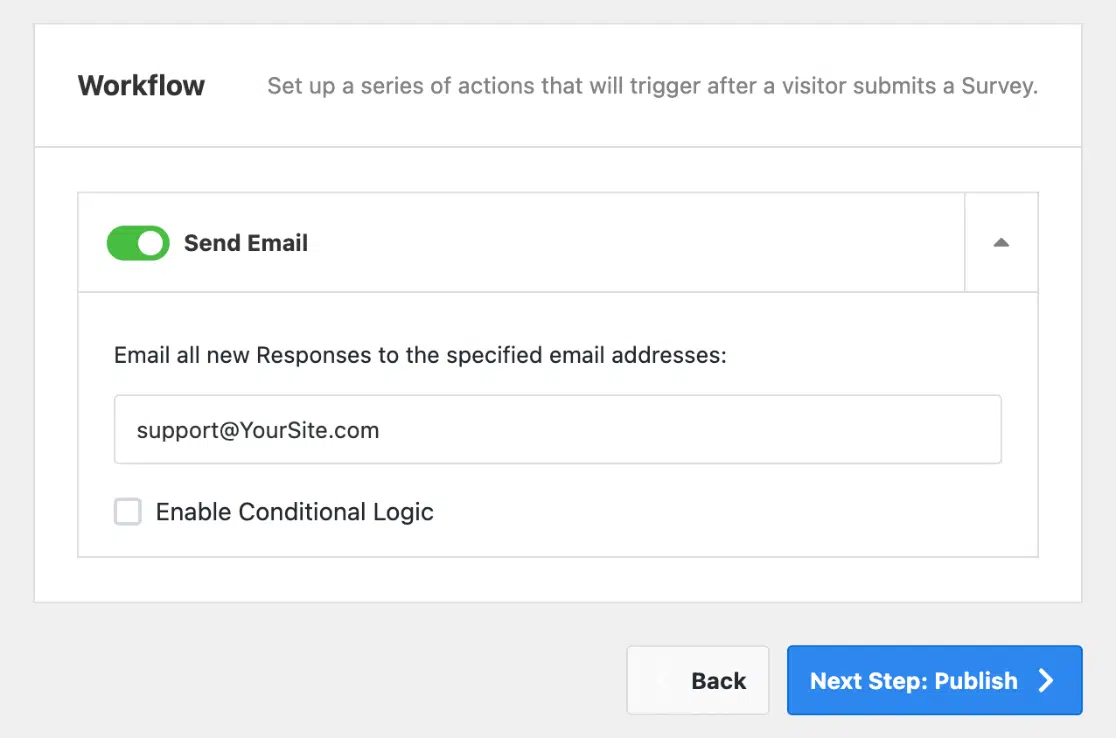
When you’ve completed setting up the notifications, click Next Step: Publish.
Step 4: Publish Your Customer Effort Score Survey
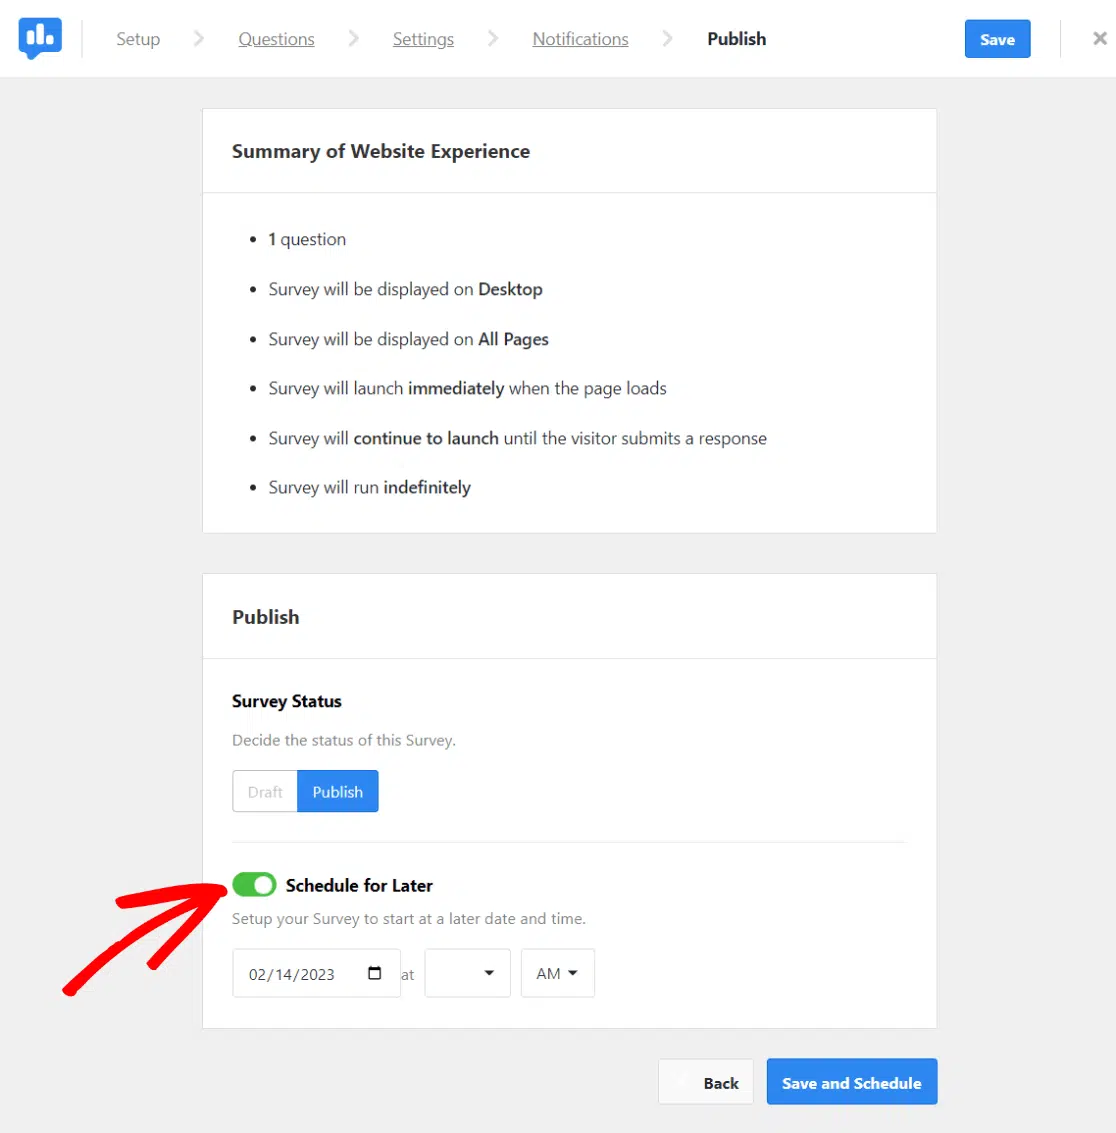
You’ll see a Summary of your survey settings on the following screen. Double-check to ensure everything looks right.
Then, click the Publish button to make it active. The button should turn blue once it’s published.
If you have UserFeedback Pro, there’s also the option to schedule your survey for a later date, giving you flexibility in when your survey goes live.
Finally, click the blue Save and Schedule button at the bottom to launch your survey.
Congratulations! Your CES survey is now live and ready to collect valuable feedback from your website visitors.
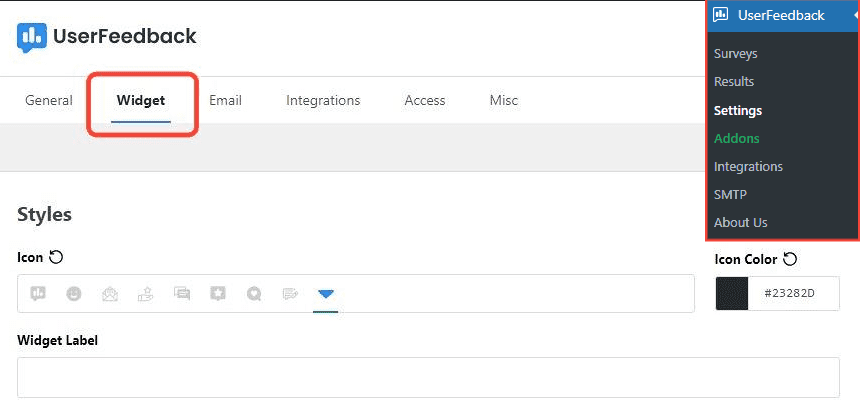
For extra customization, go to the UserFeedback » Settings » Widget in your dashboard. Here, you can tweak the survey’s position, font, and style to perfectly match your site design.
It’s important to note that the survey won’t appear to you if you’re logged into your own site. To see it in action, use a browser where you’re not logged in or in incognito mode:
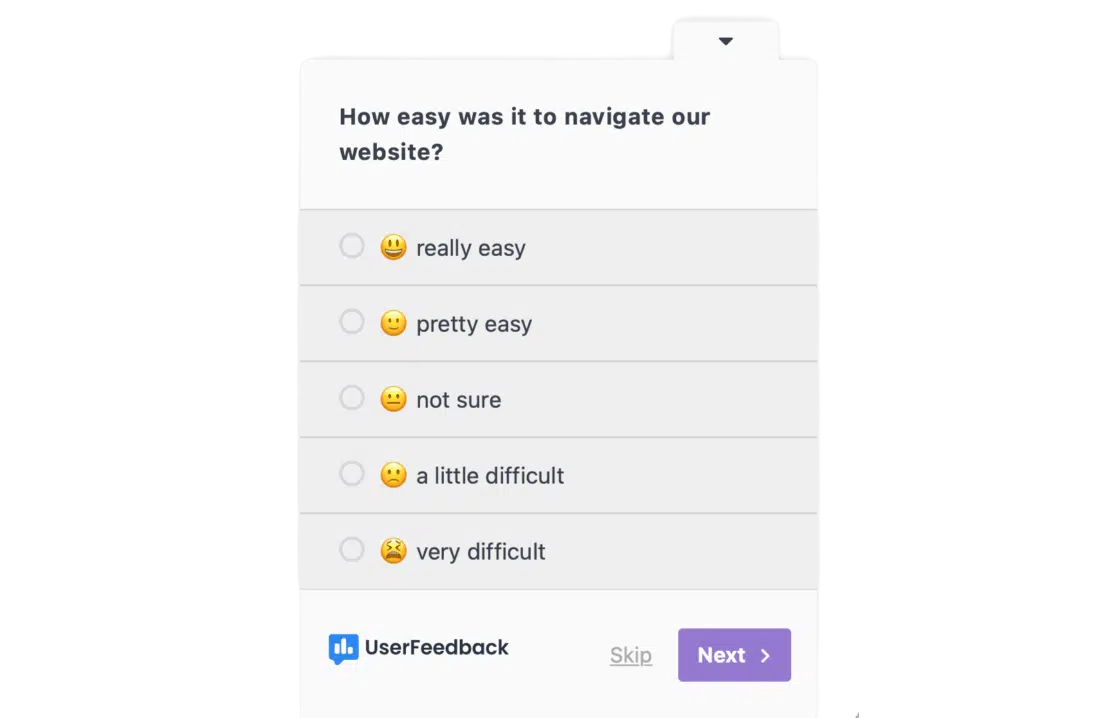
Here is another CES survey example I made with UserFeedback using emojis:
And there you have it!
You’ve successfully created a customer effort score survey on WordPress. This survey will better equip you to understand and enhance your customer experience, making life easier for your customers and boosting your business in the process.
Now, let’s check out some CES survey questions you can ask.
CES Survey Questions and Examples
Crafting the right questions is key to gathering valuable insights from your CES survey. Here are some example questions that can guide you in forming your own CES survey.
Example CES Survey Questions
- “How easy was it for you to find what you were looking for on our website?”
- “How easy was it to complete your purchase?”
- “How straightforward was it to contact our support team?”
- “How easily did you resolve your issue using our FAQ section?”
- “How easy was it to navigate our website?”
Using a Rating Scale in CES Surveys
Questions in a CES survey are typically paired with a rating scale. This scale could range from numerical (e.g., 1 to 5) to descriptive (like “very difficult” to “very easy”). Some surveys might even use emojis to visually show the range of ease or difficulty experienced by the customer.
For instance, for the question “How easy was it for you to find what you were looking for on our website?” you could have a scale where:
- 1 is “Extremely Difficult”
- 3 is “Neutral”
- 5 is “Extremely Easy”
You might also consider using statements such as “I found it easy to use this service ” and asking respondents to indicate their level of agreement on a Likert scale ranging from “Strongly Disagree” to “Strongly Agree.”
How to Calculate CES (Customer Effort Score)
Knowing how to calculate your Customer Effort Score (CES) is really important if you want to make the most of your CES survey. It gives you a standardized metric to track over time to see if your changes are making life easier for your customers.
Depending on the type of scale you use in your survey, here’s how you can calculate your CES.
Calculating CES with a Point or Likert Scale
If your CES survey utilizes a point scale, like 1 to 5, or a Likert scale, where customers rate their level of agreement with a statement, you can calculate the CES using the following formula:
Customer Effort Score (CES)= (Total Number of Responses/Sum of Customer Ratings)
This method gives you an average score that represents how much effort your customers feel they need to expend. It’s a simple calculation that clearly shows your overall customer effort.
Suppose you conducted a CES survey with 100 respondents. Each respondent rated the ease of using your online service on a scale from 1 to 5, where 1 means “very difficult” and 5 means “very easy.” After collecting all the responses, you tally the total sum of all the customer ratings, which amounts to 400.
Use the formula and your values:
- CES = 100/400 = 4
In this example, the average CES score is 4, indicating that customers found the interaction relatively easy on average. A higher score suggests that your service requires less effort, which is an excellent indicator of a positive customer experience.
Calculating CES with an Agree/Disagree or Emoji Scale
For surveys using an agree/disagree format or emoji scales (such as smiley and frowny faces), you’ll want to focus on the balance between positive and negative experiences. Here’s the formula to use:
Customer Effort Score (CES) = (% of Positive Responses−% of Negative Responses)
In this approach, you ignore neutral responses and calculate the difference between the percentage of positive and negative responses. This gives you an impression of whether more customers found the experience easy or difficult.
Imagine you conducted a CES survey in which 150 customers responded using an agree/disagree scale to the question, “I found it easy to navigate our website.” In this survey, 90 customers agreed or strongly agreed (positive responses), 30 customers disagreed or strongly disagreed (negative responses), and 30 customers neither agreed nor disagreed (neutral responses).
First, calculate the percentages of positive and negative responses, ignoring the neutral responses:
- Percentage of Positive Responses: ( 90/150) x 100 = 60%
- Percentage of Negative Responses: (30/150) x 100 = 20%
Now, use the formula to calculate the CES:
- CES = 60%−20% = 40%
A CES of 40% implies a positive balance, indicating that more customers found the website easy to navigate than those who didn’t. This metric provides a quick overview of customer perception concerning ease of use.
What Is Considered a Good CES Score?
Interpreting your CES score can be a bit tricky since what’s considered a “good” score depends on your question and scale.
Generally, a high CES score indicates a low-effort customer experience, which you aim for. However, remember that this interpretation flips if you’re using a different scale or question format.
Rather than striving for a specific industry standard, focus on how your CES score evolves over time. Tracking changes in your score is more important than the score itself, as this helps you identify trends and areas needing improvement.
Also, compare CES scores across different aspects of your business to spot any inconsistencies. For example, if most areas report similar scores but one area shows a high effort score, that’s where you should direct your efforts to enhance the customer experience.
Remember, consistency is key. Always use the same scale and questions in each CES survey to compare your data accurately over time and avoid skewing results. As long as your CES score is trending positively, you’re making strides toward improving customer satisfaction and loyalty.
Note: Gartner (CEB Global) provides some information on customer effort score benchmarks.
FAQs About CES Surveys
Here are quick answers to some common questions about CES surveys to help you understand this metric better.
What is a CES survey?
A CES survey measures how easy it is for customers to interact with your business. It focuses on customers’ efforts to accomplish tasks like purchasing products or getting support, giving you actionable insights to reduce friction and improve the overall customer experience.
What does CES mean?
CES stands for Customer Effort Score. It’s a metric businesses use to evaluate the ease with which customers can engage with various aspects of their services. CES helps identify opportunities to streamline customer interactions and enhance satisfaction by assessing perceived effort levels.
What is the difference between CES and NPS?
While CES measures the ease of customer interactions, NPS (Net Promoter Score) evaluates customer loyalty by asking how likely they are to recommend your business to others. CES focuses on transactional ease, whereas NPS assesses broader brand advocacy and satisfaction.
How can I improve my CES score?
To improve your CES score, identify friction points in your customer journey through surveys. Focus on simplifying processes like checkout, customer support, and website navigation. Regularly collect feedback, implement changes based on customer input, and track progress to ensure continuous improvement.
And that’s it!
I hope you liked this article on creating a CES survey in WordPress. To learn more, check out these other resources:
- How to Get and Improve Your Customer Effort Score (WordPress)
- How to Create a Customer Satisfaction Survey on WordPress
- How to Ask For a Review (12 Best Ways + Examples)
Haven’t you tried UserFeedback yet? Get started now!
And don’t forget to follow us on X and Facebook to learn more about gathering user feedback online.